
Dr Ken L. Ferrier – Interpreting Ancient Shorelines
One way to understand Earth’s climate is to study past changes in sea level, which leave tell-tale signatures in the geological record. Scientists often look at ancient shorelines to infer how Earth’s oceans and ice sheets responded to previous climates. Geologist Dr Ken Ferrier has found evidence that rivers carrying vast amounts of sediment may have deformed these geological features and altered sea level near them. This implies that using paleoshorelines to infer the sensitivity of sea level to climate change requires accounting for the action of rivers.
Understanding Ice and Sediment Loading
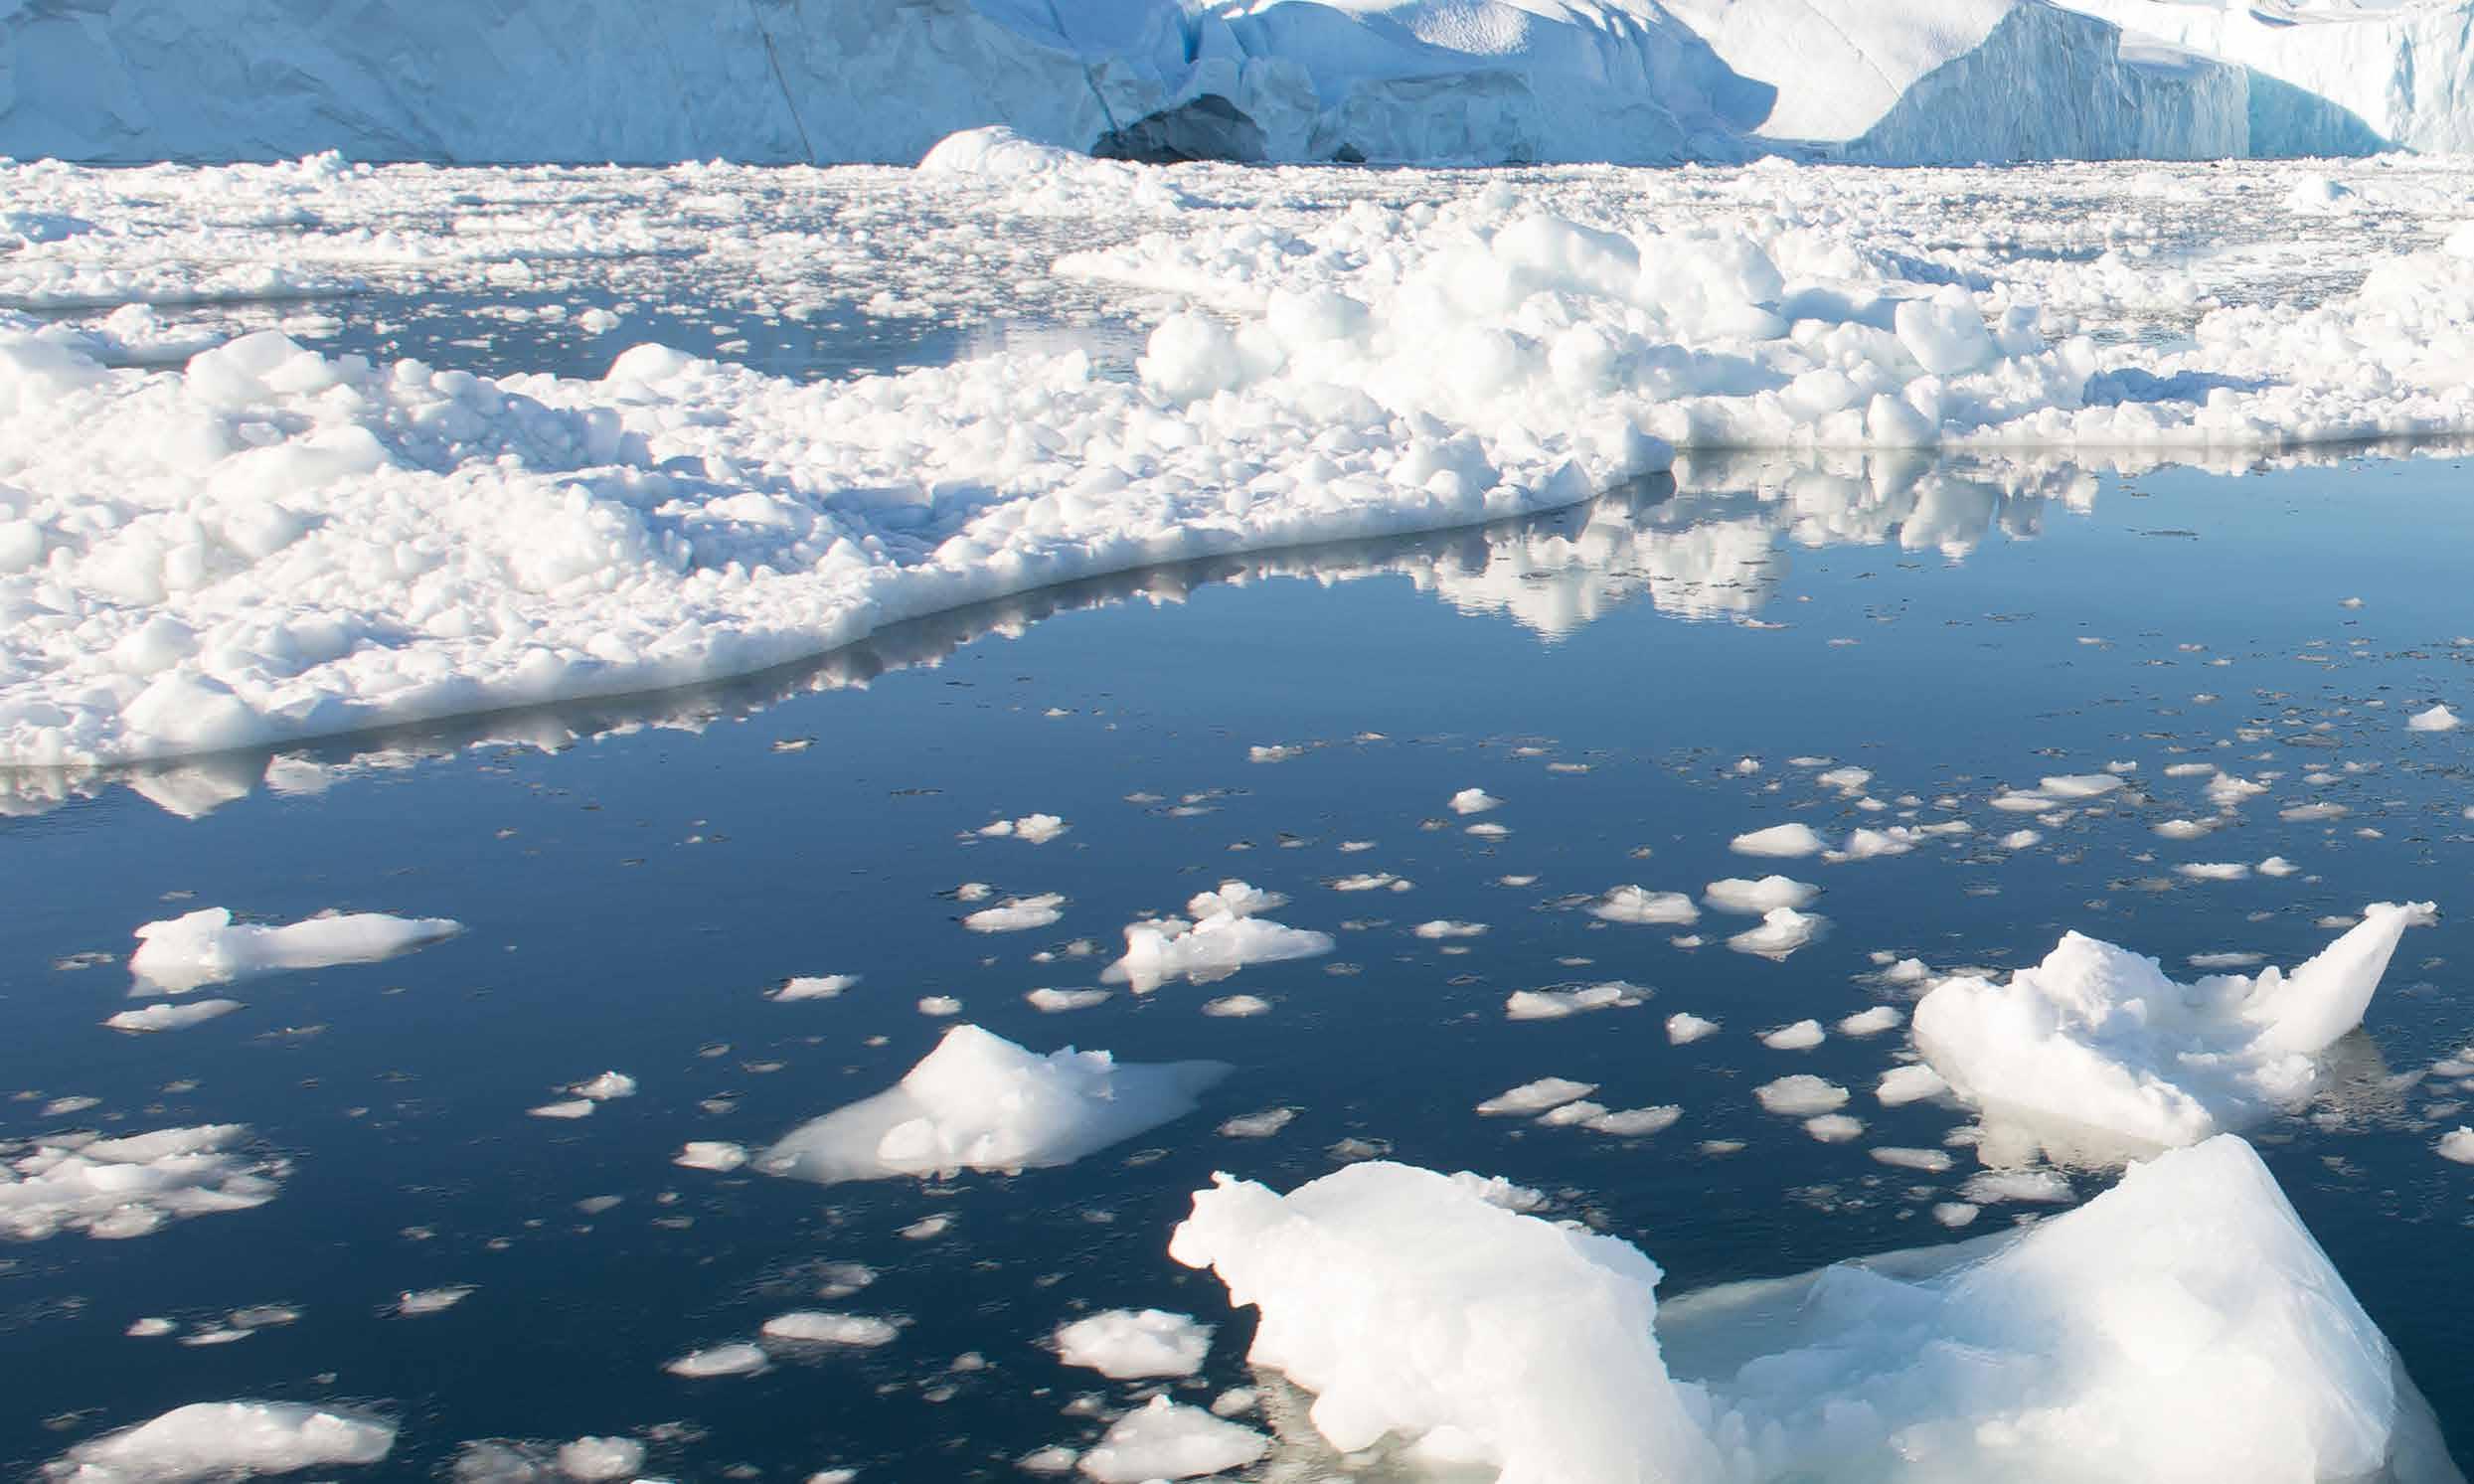
Scientists agree that mean global sea level is rising. Measurements over the last century indicate that air and ocean temperatures are rising and ice caps and glaciers are shrinking as atmospheric carbon dioxide is increasing. The addition of new water into the ocean, along with the expansion of the seawater as it warms, have led to a rise of mean global sea level that has accelerated to more than 3 mm per year in the past two decades. Most of the present-day rise in sea level is driven by recent increases in temperature. A portion of the changes in sea level, however, is driven by ongoing responses to things that happened thousands of years ago. The classic example of this is the most recent ice age, in which ice sheets reached their maximum extent about 26,000 years ago before gradually retreating to their current state. As they melted, their enormous weight vanished, and the parts of Earth’s crust that had been pushed down under the ice sheets began to rise up. This so-called crustal uplift continues today, and is highly variable from place to place. The most dramatic uplift is found in places that were once covered by the thickest ice sheets, like Hudson Bay and Scandinavia, but it has also been observed in the European Alps. There, scientists have conjectured that the 1–2 mm annual growth in elevation is mostly due to land ‘rebounding’ from the weight of former ice masses. Evidence of this process, known as glacial isostasy, is seen around the world. Sometimes, the effect of the weight of ice is so large that it causes sea level to change over a relatively short geological time period. An example of this is found in the eastern United States, where ancient ice cover is thought to have shifted the so-called paleosea level by as much as 20 metres. Distortions such as these thwart scientists who look for climate clues in ancient seashores. They often use these paleoshorelines to estimate the amount of ice and ocean that covered the earth at various points in the past. Some scientists like Dr Ken Ferrier, however, don’t think that ice is the only phenomena moving paleoshorelines around. He wonders if huge sediment loads being carried by rivers into the ocean are also involved. Already, Dr Ferrier and his team, the Surface Processes Group at the Georgia Institute of Technology in Atlanta, have demonstrated that sediments carried by water into the ocean can perturb sea level just like large ice masses do. The team has found that erosion and deposition of sediment, which are especially rapid near large rivers, have been significant enough to deform and change paleo-sea-level markers near large rivers. ‘In many places, local sea-level changes are strongly influenced by sediment that is transferred from continents to the ocean. In Earth’s largest rivers, the Amazon and the Ganges-Brahmaputra, sediment fluxes exceed 1 billion tons per year. These fluxes are so large that they perturb sea level,’ claims Dr Ferrier.
‘In the real world, it is not feasible to perform large-scale vegetation
perturbation experiments to dynamically assess feedbacks to the
atmosphere, so a statistical method is necessary’
Indus River – Arabian Sea
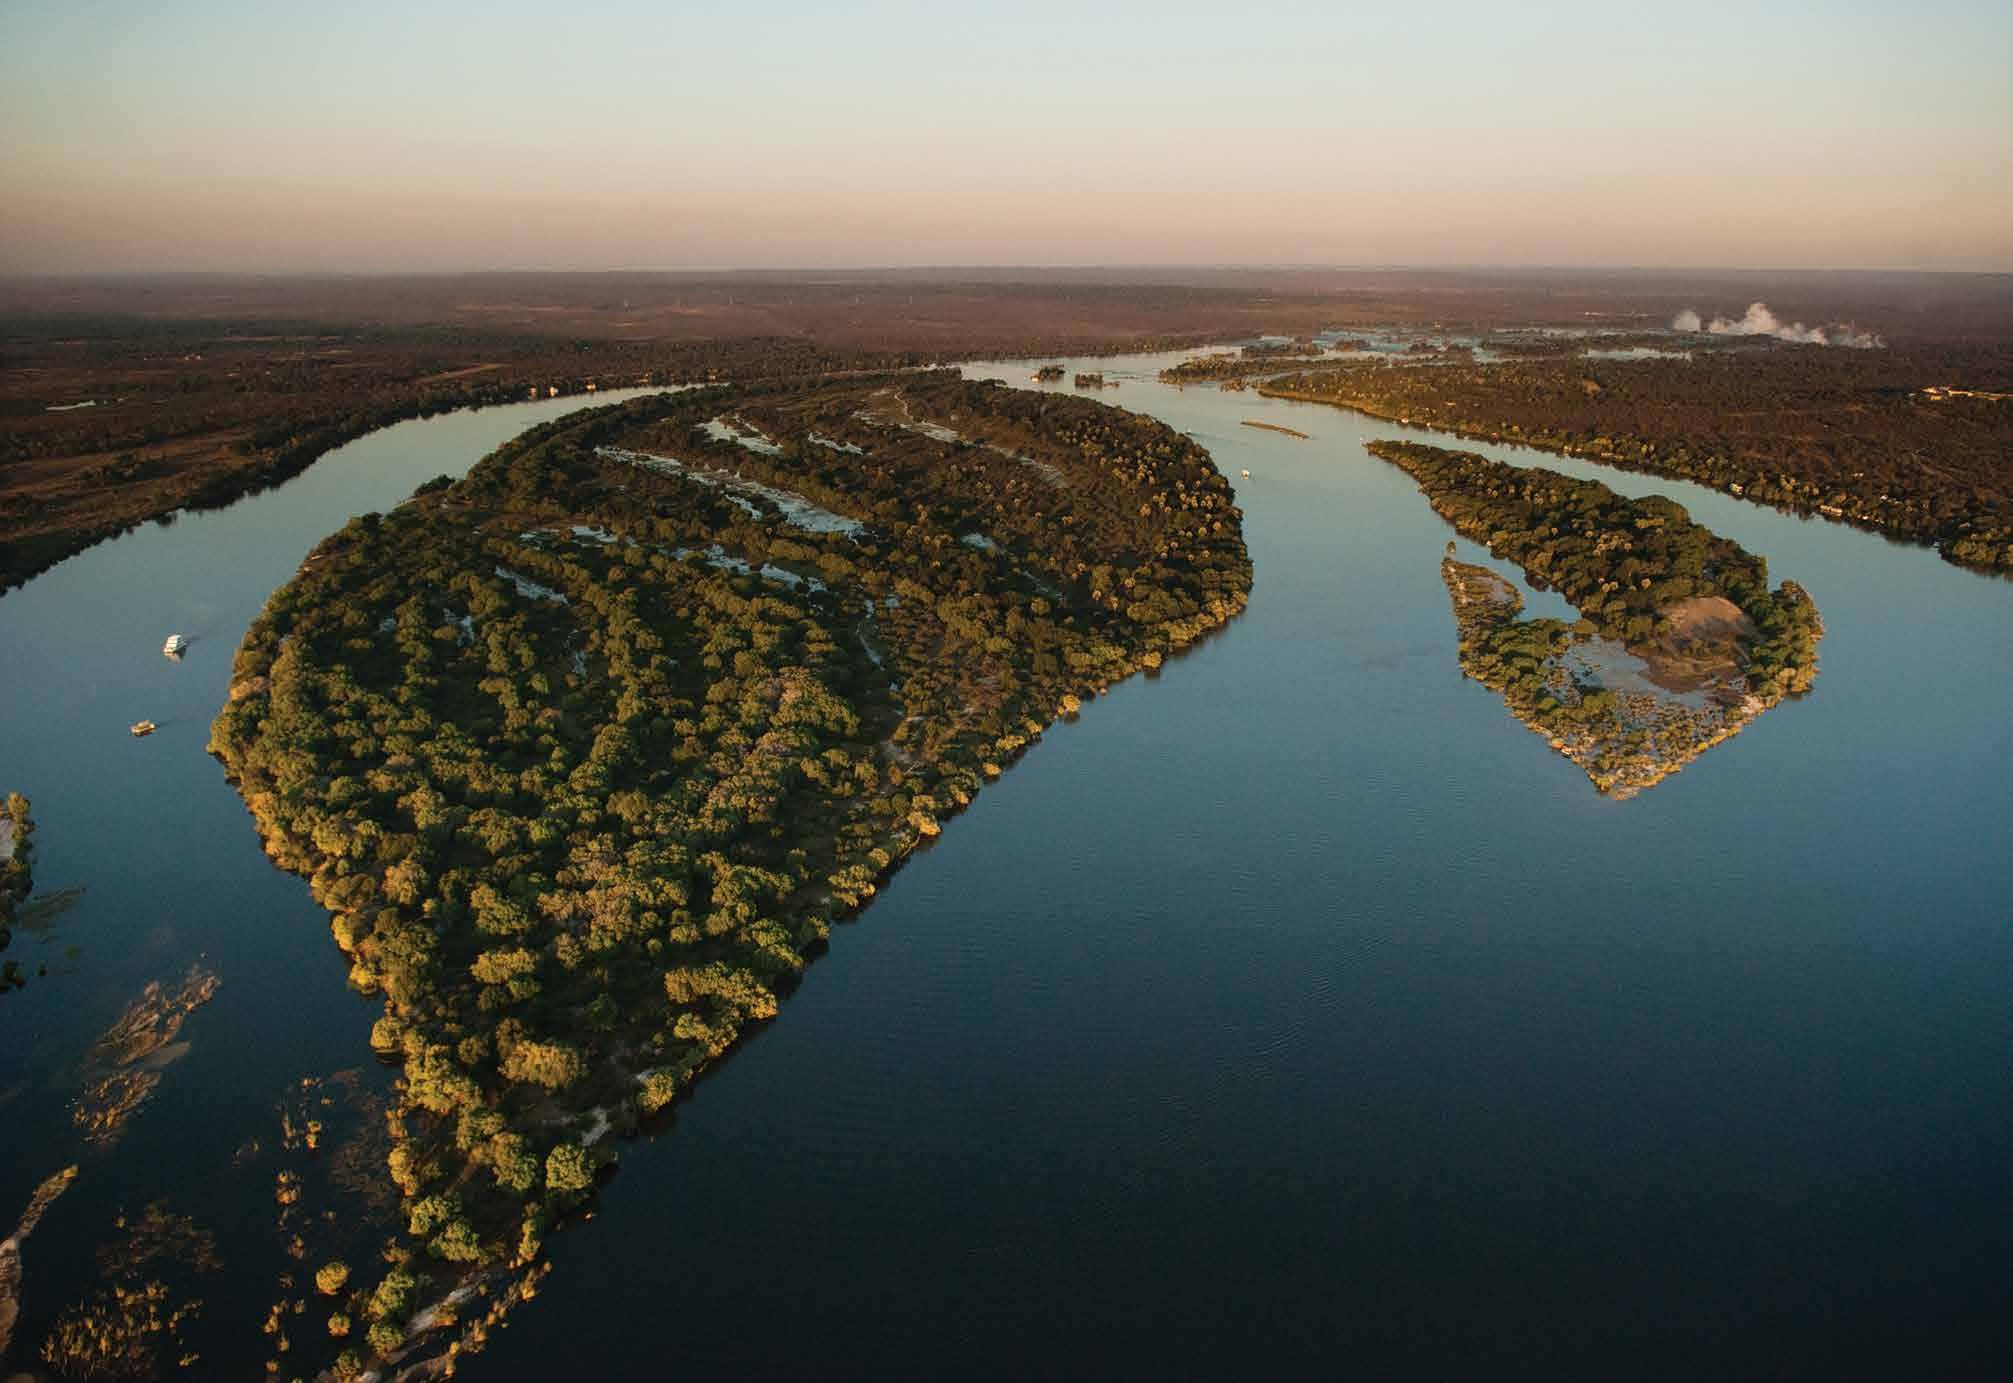
One of Dr Ferrier’s studies that support this claim involves the modelling of the Indus River. The Indus originates in the Himalayas and flows into the Arabian Sea, and has a large delta at its mouth. The Indus is notable for its length (3,200 kilometres) and the amount of water it discharges (approximately 243 cubic kilometres a year), but what really makes it stand out is the amount of sediment it carries. Before massive dams built in the 20th century trapped most of the sediment in reservoirs, the Indus River moved some 250 million tons of stones, sand and silt into the ocean per year, making it one of the top ten sediment-producing rivers in the world. This feature of the Indus – referred to as fluvial sediment load – is the prime reason that Dr Ferrier and his colleagues chose it for their modelling study. If sediment loading was indeed capable of influencing sea level, they’d be sure to see it there. In their study, they set out to construct a history of sediment loading between the present and 120,000 years ago, when Earth’s most recent glacial cycle began. The team reckoned that this amount of time is also long enough for Earth’s thick crust and viscoelastic mantle to respond to weighty sediment loads. They used a ‘gravitationally self-consistent global model’, which assumes that Earth is symmetrical, rotating, and has a viscoelastic mantle under an elastic lithosphere, and which accounts for changes in Earth’s gravity field as water moves across the Earth’s surface. Changes in ice loading as well as sediment loading for the last 120,000 years were incorporated into the model. Using a widely-used reconstruction of global ice history and distribution, known as ICE- 5G, the team could input changes in ice mass. For sediment loading, however, they themselves pieced together a history from published data on erosion and deposition rates, including data from sediment cores. In their 2015 publication in Earth and Planetary Science Letters, Dr Ferrier and his colleagues conclude that the Indus River produced such large sediment fluxes that they were capable of changing sea level near its delta. They explain that the dominant way that sediment induces sea-level rise is through subsidence of the ocean floor.
The group also found that sediment produces different sea-level ‘signals’ compared with those of ice sheets. Over the past few million years, as Earth’s ice sheets have cyclically grown and shrunk, sea level has responded by oscillating up and down dozens of times. By contrast, sea-level responses to sediment loading have continued growing larger over time, because the sediment redistribution is largely a one-way street – sediment moves from the continents to the oceans, but rarely in reverse. At the Indus delta, the team estimate that the gradually growing sediment loads may have caused sea level to rise by as much as 30 metres in the last 120,000 years. According to Dr Ferrier, scientists using paleoshorelines to estimate global ice volumes in the past have to correct for this effect of sediment loading in places with large sediment fluxes. Otherwise, they could misinterpret the sensitivity of sea level to changes in climate, especially in sites near large rivers such as the Indus.
Three-Million-Year-Old Shorelines
Dr Ferrier’s Indus models demonstrated that in over a relatively short period of 120,000 years, sediment loads significantly perturbed sea level around the Indus delta. Now his team is taking a bigger step back in time – to approximately 3 million years ago – to a period known as the Mid-Pliocene Climate Optimum (MPCO). Scientists view this period as relevant to today’s climate for many reasons. For one, it is the most recent time in Earth’s history with atmospheric carbon dioxide concentrations as high as those Earth is projected to experience soon, which suggests that its climate may be similar to the climate Earth may soon have. Estimates of mean global sea level during the Mid-Pliocene Optimum range from 10 to 40 metres higher than they are today, which imply a wide range of possibilities for what’s ahead for modern civilisation. Finally, the planet’s continents and oceans were arranged around the planet much like they are today. ‘Understanding how sea level will change in the future requires quantifying how much present-day sea-level changes are affected by ongoing responses to ice and sediment loading in the past’ As such, the Mid-Pliocene Optimum is ideal for understanding rising sea level in the future. ‘One way to predict sea-level changes is to look forward in time and use numerical models that predict sea-level changes in the future,’ says Dr Ferrier. ‘Another way is to look into the past and examine the geologic record of past sea-level at moments that had climates similar to those we are about to experience.’ To examine sea-levels from the Mid-Pliocene, Dr Ferrier’s team has chosen three ancient shorelines: the Orangeburg Scarp in the eastern United States, the De Hoop plain in South Africa, and the Roe Plain in Australia. These so-called paleoshorelines, which today appear as terraces well above modern sea level, all formed at sea level around the same time. ‘These past sea-level changes are recorded as relatively smooth, planar features that used to be at sea level but no longer are,’ Dr Ferrier explains. ‘These are useful for studying past sea-level changes because, if the time of their formation is known, they mark sea level at a given location at a given moment in time – in other words, the local paleo-sea level.’
Today, Dr Ferrier’s study sites are all found at different elevations, even though they formed at the same time. For example, the remnant shoreline known as the Orangeburg Scarp extends from Florida to northern Virginia. During the MPCO, an ancient ocean would have existed around 100 to 200 kilometres further inland. Over on the tip of South Africa, the De Hoop coastal plain would have been forming around the same time. Today, the Orangeburg Scarp ranges in elevation from 35 to 80 metres while the De Hoop coastal plain doesn’t rise above 30 metres. Why the difference? The answer is that geological forces have warped these paleoshorelines by different amounts over the last 3 million years. Dr Ferrier thinks sediment loading is a major player, but it remains an open question how much the warping of the shorelines is due to sediment and how much is due to other geological processes, like convection of the underlying mantle. In a proposal with Professor Jerry Mitrovica (Harvard University) for the US National Science Foundation, Dr Ferrier builds his case for quantifying this. Previous studies have focused mostly on ice sheets and flow in the earth’s mantle, but few on how sediment loads might have twisted and shaped these paleoshorelines. As with the Indus River in his previous modelling efforts, Dr Ferrier believes this effect can’t be ignored, especially when trying to understand ancient oceans and climate. ‘We propose to take steps toward closing this knowledge gap by constructing histories of sediment erosion and deposition in the regions around these paleoshorelines, and by modelling the effects that those sediment loading histories had on sea level,’ he states.
Paleoshorelines are Key to the Future
Dr Ferrier tells Scientia that he enjoys studying this topic because of the environmental challenges posed by future sea-level changes. He strongly believes that to plan for the future you have to look to the past, like he’s doing with paleoshorelines. He says, ‘Because sea level changes at different rates in different places, interpreting local sea-level changes based on paleoshorelines requires modelling how the Earth’s shape and gravity field have deformed since the time the paleoshorelines formed. That’s what our models do. They help us compute how much sea level should have changed everywhere on Earth, which helps us interpret past sea-level changes and in turn helps us predict how sea level is likely to change in the future.’ Dr Ferrier also thinks his sea-level work will improve our understanding of how Earth’s topographic features, such as mountains and canyons, are formed and carved over time. ‘One of the strongest controls on the evolution of continental topography is changes in sea level, which set the boundary condition for landscape evolution, so that provides further motivation,’ he explains. ‘To understand how mountain ranges evolve, you need to understand how sea level changes over time too.’
Meet the researcher

School of Earth and Atmospheric Sciences
Georgia Institute of Technology Atlanta,
Georgia USA
Since 2014, Dr Ken L. Ferrier has been an Assistant Professor at the Georgia Institute of Technology, where he heads up the Surface Processes Group that focuses on the evolution of the Earth’s surface and sea level dynamics. After obtaining his AB in Physics at Cornell University in New York in 2000, Ferrier went on to receive a PhD in Earth and Planetary Science at University of California in Berkeley, California, in 2009. From 2010–2012, Dr Ferrier was a postdoctoral associate at MIT in Cambridge, Massachusetts. In 2012, he received a CIFAR (Canadian Institute for Advanced Research) postdoctoral fellowship at Harvard University in Cambridge. He is currently a member of the executive committee of the Earth and Planetary Surface Processes Focus Group in the American Geophysical Union (AGU).
CONTACT
T: (+1) 404 385 4418
E: ferrier@gatech.edu
W: http://ferrier.eas.gatech.edu
KEY COLLABORATORS
Jerry Mitrovica, Harvard University
Liviu Giosan, Woods Hole Oceanographic Institution
Peter Clift, Louisiana State University
Qi Li, Georgia Institute of Technology
FUNDING
National Science Foundation
REFERENCES
KL Ferrier, JX Mitrovica, L Giosan, PD Clift, Sea-level responses to erosion and deposition of sediment in the Indus River basin and the Arabian Sea, Earth and Planetary Science Letters, 2015, 416, 12–20.

Download