
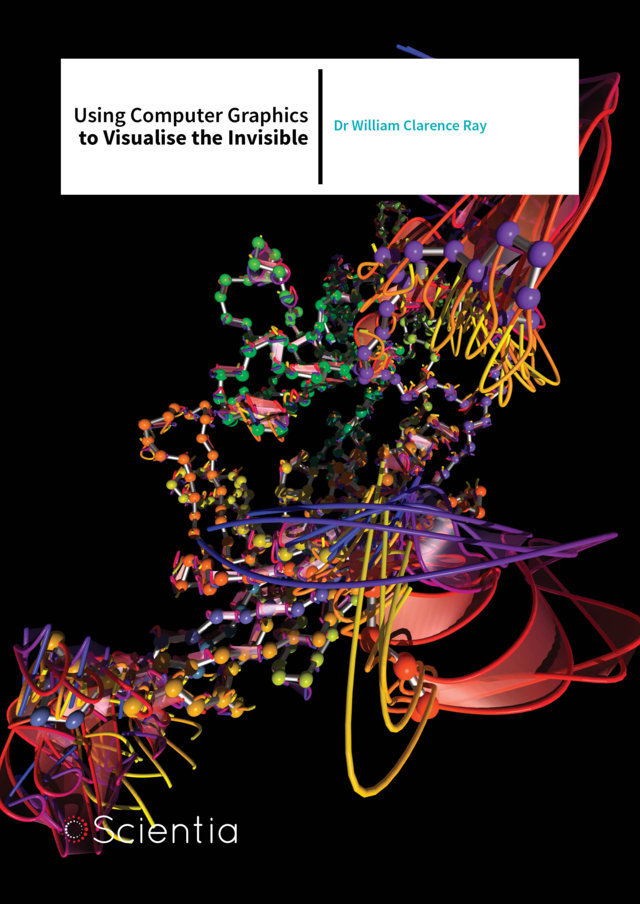
Dr William Ray – Using Computer Graphics to Visualise the Invisible
Biophysicist Dr William Ray and colleagues at The Ohio State University and the Battelle Center for Mathematical Medicine at The Research Institute at Nationwide Children’s Hospital in Columbus, develop novel approaches to graphically visualise what happens to proteins on a molecular scale to better understand how they function.
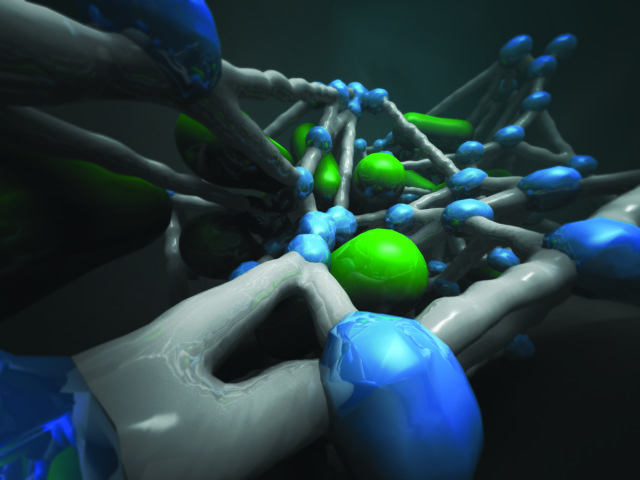
Visualising the Moving Parts of Molecules
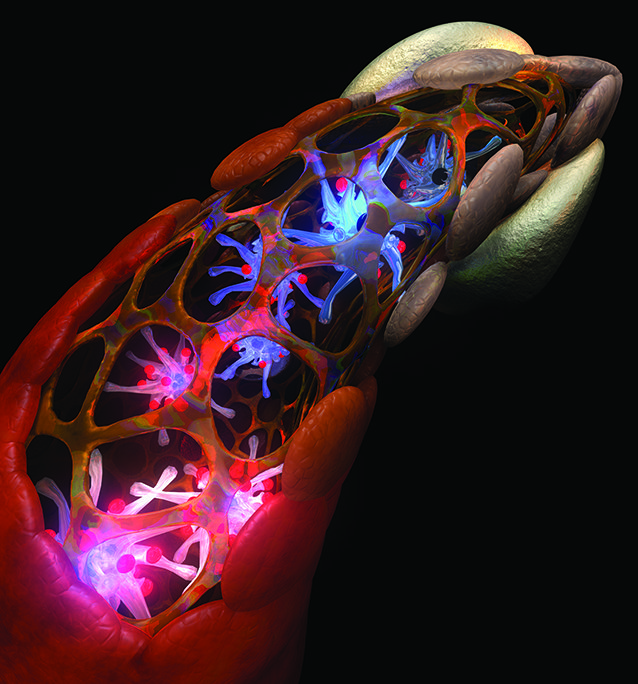
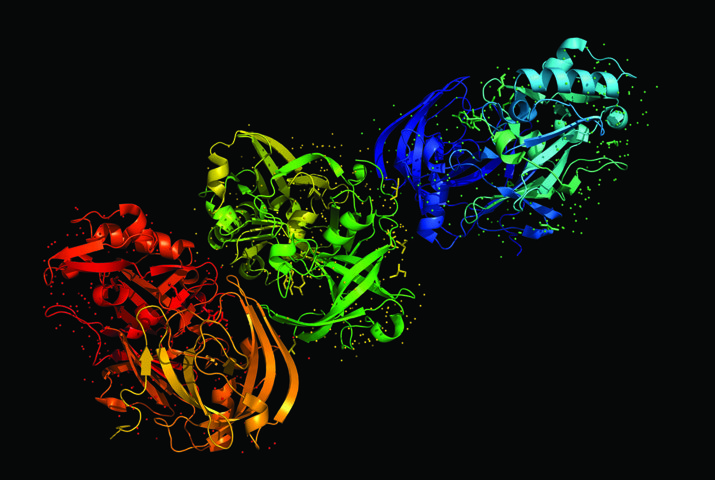
We have all seen models and graphics of complex molecular structures, like proteins or DNA sequences. Some look like coloured balls connected by lines – the balls representing molecular nuclei or even whole amino acid groups, the lines representing molecular bonds. Other representations may be a bit more elaborate, with more curves and rounded areas. While this might suffice for teaching that child about proteins and enzymes and such, it certainly doesn’t suffice for the serious scientist. There simply aren’t enough balls and sticks in the world to do this, for one thing. For another, you can’t tell how a protein’s function will change with a change in chemical composition simply by switching out a coloured ball in the model for a different coloured ball.
Since the description of the structure of DNA in the mid-twentieth century, there has been an explosion in our knowledge of DNA structure – that makes up genes and chromosomes – and of proteins – those important macromolecules that are coded for by DNA. Whole databases have come online with massive volumes of data, such as the internationally renowned Human Genome Project (HGP) and the Protein Data Bank (PDB). The HGP aims to identify and map all the genes of the human genome. The PDB maintains a database of the three-dimensional structures of large biological molecules, such as DNA, RNA and proteins, that result from imaging proteins with technology such as NMR spectroscopy, X-ray crystallography or cryo-electron microscopy. Data from researchers around the world is collected in such large databases and made available to scientists everywhere. But simply knowing the sequence or static structure of these molecules doesn’t tell us about their function. It also doesn’t give us an easy way to predict how small changes in the molecules – mutations – will affect their function. There are just too many pieces and too many connections. Sometimes more data is too much data. This is what some call ‘Big Data’ – data collections that are large and complex and sometimes simply become information overload. This is where Dr William Ray and his colleagues in Ohio are hard at work. They want to graphically represent this type of data in a way that is easy to ‘see’ and use, to allow scientists to understand the moving parts of molecules.
Download
Reference
https://doi.org/10.26320/SCIENTIA5
Share
‘We are simultaneously working towards applying the visualisation and analysis insights they have gleaned from molecular biology to other life-sciences domains, such as clinical outcome measures and genetic cancer research’
Wearing Two Hats – A Jack of Two Trades
Dr Ray is a scientist trained in Computer Science, specialising in both computer graphics and human-computer-interfaces. He is also a Biophysicist, focused on the molecular biology of ancient bacterial transcription through the lens of microbiology. His computer graphics background superimposed upon his microbiological background has made him particularly interested in visual representations of data, most specifically protein and nucleic-acid sequence data.
Dr Ray’s experience and work in this area and networking with that scientific community led him to believe that the de-facto use of sequences – which coloured balls go in what order in a molecular model – as a way of communicating about proteins and nucleic acid chains fundamentally colours the way that researchers think about these molecules and how they work. ‘Traditional representations of the data as literal character sequences have historically impeded full understanding of actual molecular products,’ he tells us. This static representation itself produces significant inherent biases in tools – such as computer algorithms and modelling programs – that are intended to analyse the molecule’s properties. ‘Ultimately, these biases limit the tools’ analytical capabilities, resulting, for example, in genome screening algorithms and software that are systematically incapable of recognising many of the effects of potential pathogenic variants in protein or DNA sequences,’ Dr Ray explains.
Along with his colleagues, he uses his expertise in computational biology and computer graphics to solve this problem with special graphics programs, while at the same time making it user-friendly and aesthetically pleasing to the user. As he puts it: ‘I am concerned that users find a tool appealing and friendly enough to use, as well as requiring that it be computationally and biologically correct.’
Working with Big Data? Maybe You Need a Big Organisation
Since coming to Ohio State and the Battelle Center and tackling the problem of analysing large biological databases, Dr Ray has developed alternative ‘sequence’ encodings and visualisations that avoid the analytical and communication limitations of pure sequence-based representations for proteins and nucleic acids. He and his group have demonstrated that their improved encodings enable significantly more insight into the functional consequences of changes to ‘sequence’. In other words, if you change an amino acid or nucleic acid in your molecule, what happens to the ultimate function of that molecule or the molecules that result from it? Dr Ray and his colleagues have developed computer-based tools that have contributed fundamental new insights into the basic molecular determinants of function and disease. In fact, some of the visualisations produced by them have been featured in art exhibits around the world. The group has received funding from the NSF to continue improving their encodings and visualisation tools, and NIH funding to apply these tools to several different biological questions. ‘We are simultaneously working towards applying the visualisation and analysis insights they have gleaned from molecular biology to other life-sciences domains, such as clinical outcome measures and genetic cancer research,’ Dr Ray explains. After all, having a map of the human genome is worthless unless you can do something helpful with it, like treat cancer. But in 2010, Dr Ray and others with his interests got a huge boost – the IEEE joined the party.
The IEEE – originally founded in 1884 with the rise of the electrical industry and telegraph – is the Institute of Electrical and Electronics Engineers. But since everything runs on electricity now, membership today includes computer scientists, software developers, information technology professionals, physicists, medical doctors and many others. In 2010, the IEEE became interested in the science of biological data visualisation. It’s as if the world had just beat a path to Dr Ray’s door. The IEEE added a conference track to their other standard topic tracks and called it BioVis. They invited Dr Ray, along with several other researchers working at this nascent interface of biology and data visualisation. They had the honour of being invited to develop and lead an international BioVis symposium. Since Dr Ray (under his biophysics hat) happened to be the most senior biological expert in this group, he developed a biological data analysis contest for the symposium. This contest introduced grand-challenge biological data visualisation and analysis problems from the bio/life-sciences to computational experts around the world. The expertise and capabilities of a 395,000-member organisation was now focused on Dr Ray’s crusade, visualising complex biomolecular data.
For five years Dr Ray was responsible both for the day-to-day operation of the contest, as well as for providing the biological expertise to train the computationalists so that they could better address the actual end-user needs. After all, any software program that a biologist can use in his laboratory should be easy enough for a biologist to actually use. ‘One of the teams I mentored developed a novel approach to visualising different protein stabilisation choices made by different branches of a phylogeny, which was so appealing that it was displayed at the New York Museum of Modern Art, and so useful that it has been added to the standard collection of web analysis tools provided by EMBL (Europe’s version of the NIH),’ Dr Ray recalls. Under his leadership, the data analysis contest portion of BioVis has become so successful that it was adopted by the SAGE BioNetworks DREAM challenge team for management and incorporation into future international DREAM challenge projects. SAGE BioNetworks is a non-profit research organisation that works to develop predictors of disease and encourage research into health by facilitating open access to the scientific data and encouraging patient engagement in the research process.
And as far as networking, Dr Ray has collaborated with essentially all of the other senior practitioners in the growing BioVis domain. He continues to work with the BioVis community, this year in the capacity of co-chair of the Posters track, and will be leading other aspects of their symposiums and workshops in the future, spreading the gospel of graphics. But even with all of this activity, he’s still hard at work back in Ohio.
Meanwhile, Back at the Lab
Over the years, Dr Ray has had his fingers in a few scientific pies. For example, he has collaborated with a number of experts in viral vector therapy to use a structure-based design to genetically modify an adenovirus for use as a viral therapy for neurologic disease. He has also collaborated with experts regarding the structure of the F-protein in RSV. Current collaboration topics also include pre-eclampsia and biofilms.
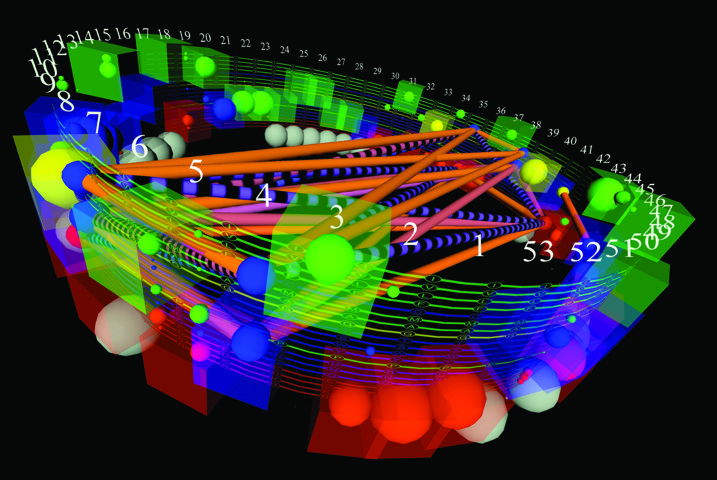
Dr Ray’s lab has developed and continues to enhance a visual analytics tool they call ‘StickWRLD’, that creates an interactive 3D representation of biological data. The tool was originally developed for visualising DNA sequences, and later expanded include protein sequences. Recently, the lab has adapted StickWRLD to visualise SNP data and canceromics data. The StickWRLD user can dynamically change the statistical thresholds of their analysis and pan and zoom the graphics generated by the program. Using this program on protein data, they found that they can identify positions on a protein that are functionally required versus those that aren’t necessary for function. This type of information is important if you want to engineer a protein for a certain function. Do you need this part or that part for the protein to function, or can you substitute something else here and not adversely affect the function?
Dr Ray also worked with his OSU colleagues on a system to produce high-quality renderings of molecular motion. They used the pathlines of atoms in a molecule (the route an atom moves through time within the molecule) versus the usual timeline rendering – the shape a molecule is overall at different times. They call their web-based system for generating time-lapse molecular-flow images and motion structures ‘MoFlow’. It can take protein structure files from the PDB and create an interactive web-based visualisation of molecular motion that can even be printed on a 3D printer. They found that pathlines are more easily understood than timeline representations. As well, pathlines also represent motion directly, rather than representing structure with inferred motion. And MoFlow is probably an apt title for Dr Ray himself. Between work at the OSU and the Battelle Center, and his work with IEEE’s BioVis and the NIH and NSF, he is definitely a moving and flowing researcher.
Meet the researcher

Dr William Clarence Ray
The Ohio State University
Columbus
USA
Dr William Ray received his Ph.D. in Biophysics in 2000 from The Ohio State University. Thereafter he did a postdoctoral fellowship at the Columbus Children’s Research Institute in Columbus, and then took a research scientist position there for a number of years before becoming a Research Assistant Professor of Paediatrics at The Ohio State University in 2008. In 2011 he was named an Assistant Professor of Paediatrics at OSU, where he teaches graduate courses, as well as supervising the thesis research of PhD students and mentoring undergraduate and high school students. He is also Principal Investigator in the Battelle Centre for Mathematical Medicine at The Research Institute at Nationwide Children’s Hospital, where he was recruited as a faculty member in 2002 to build the infrastructure necessary to support research computing at the institute, and he has served as director of the research computing core, as well as serving on the institutional research-computing advisory committee, and the research-computing executive committee.
CONTACT
E: ray.29@osu.edu
T: (+1) 614 355 5645
W: http://www.stickwrld.org
KEY COLLABORATORS
Dr Christopher W. Bartlett, The Research Institute at Nationwide Children’s Hospital
Dr Irina Buhimschi, The Research Institute at Nationwide Children’s Hospital
Dr Mark Peeples, The Research Institute at Nationwide Children’s Hospital
Dr Thomas Magliery, The Ohio State University
FUNDING
NIH/NIAID
Medimmune, LLC
Tibotec BVBA (Johnson & Johnson)
NIH/NIDCD
NSF
REFERENCES
BP Cromeens, JR Leonard, LS Governale, RE Kirschner, GD Pearson, MA Levitt, RJ Wood, RK Thakkar, MP Islam, JL McKinney, EE Whitaker, JA Bryant, BH Adler, WC Ray, B Hoehne, GE Besner, The separation of pygopagus conjoined twins with fused spinal cords and imperforate anus, Journal of Pediatric Surgery Case Reports, 2016, 11, 47–49.
R Wolfgang Rumpf, S Dabdoub, A Shindhelm, WC Ray, MoFlow: visualizing conformational changes in molecules as molecular flow improves understanding, BioVis, 2015. 9, S5.
WC Ray, SL Wolock, NW Callahan, M Dong, Q Quinn Li, C Liang, T Magliery and CW Bartlett, Addressing the unmet need for visualizing conditional random fields in biological data, BMC Bioinformatics, 2014, 15, 202.
HM Costello, WC Ray, S Chaiwatpongsakorn and ME Peeples, Targeting RSV with Vaccines and Small Molecule Drugs, Infectious Disorders – Drug Targets, 2012, 12, 110–128.
WC Ray, MAVL and StickWRLD: visually exploring relationships in nucleic acid sequence alignments, Nucleic Acids Research, 2004, 32, W59-W63.
![]()